Nahom Beyene, MSEng, Rory Cooper, PhD, Aaron Steinfeld, PhD
Department of Rehabilitation Science and Technology, University of Pittsburgh
5044 Forbes Tower, Pittsburgh, PA 15260
Human Engineering Research Laboratories, VA Pittsburgh Healthcare System, Pittsburgh, PA
Robotics Institute, Carnegie Mellon University
5000 Forbes Avenue, Pittsburgh, PA 15213
ABSTRACT
This paper presents community mobility trends by driving status among people with disabilities and senior citizens in New Delhi, India. Key factors in the study include frequency leaving the home, using transportation, and traveling to common locations in the community. Study participants self-reported experiences as drivers or transportation users by questionnaire. Responses showed a limit to the frequency of transportation use among people with no driving experience as compared to people driving currently or in the past. Transportation mismatch, where people did not use a preferred mode of transportation, was reported by all groups. These findings suggest people are driven internally to keep engaged in society, and there is a need to support growth of international driver rehabilitation services for maximum participation.
KEYWORDS
Driving Status, Mobility, Community Participation, Transportation Usage, Travel Frequency
BACKGROUND
In society, the general public still bears perceptions of people with disabilities (PWD) that marginalize their needs and rights including access to and participation within the community (1). The efforts of many community organizations have played a powerful role towards promoting community participation, combating negative perceptions, and securing communities of support for PWD and senior citizens. In New Delhi, there are organizations such as AccessAbility and Samarthyam who are informing policy makers and defending the interest of PWD regarding access and participation needs in the community (2). India presents the opportunity to conduct unique studies on community mobility given alternative transportation options and infrastructures as compared to the United States. This study presents measures of community mobility and travel frequency to common locations in relationship to driving status. At the same time, the study investigates transportation mismatch, where a person is unable to use their preferred method of transportation. This measure is considered for its influence on community participation.
METHODOLOGY
The Institutional Review Board at the University of Pittsburgh and Committee for the Protection of Human Subjects at the Indian Spinal Injuries Centre approved the following work under a broader study on factors contributing to driver cessation among people with disability and senior citizens.
Subject Recruitment:
Volunteers for the study included people with disabilities (physical/sensory) and individuals aged 55 and above as members of the aging population. Using a convenience (non-statistical) sample, subject recruitment took place by word of mouth, referrals, e-mail advertisement, postal mail, phone calls, and posted flyers. Delivery of the study advertisement flyer or text took place with the support of local organizations servicing people with disabilities and the aging population in New Delhi, India.
Experimental Protocol:
All volunteers who inquired about participation were given an informational script about the research study. Participants did not undergo a formal consenting process because the study was approved as an exempt protocol for not collecting personal health identifiers or recruiting minors. A unique subject ID was assigned in order to differentiate survey responses after collection. Participants were then prompted to begin the questionnaire, proceed at their own pace, and address any questions to the study investigator for clarity on the questions. A research assistant was available to provide assistance in Hindi when required. The order of questions remained consistent, and compensation was provided upon full completion of the questionnaire.
Study Questionnaire:
The study questionnaire combined multiple surveys and extra questions into three parts with 70 questions. A survey developed by the Quality of Life Technology Engineering Research Center presented demographics, health and disability related questions (3). Along with questions to determine driving status, two additional surveys were included to provide insight into participation and mobility with respect to environmental influences as facilitators and barriers (4, 5). The only adjustment involved addition of answer responses unique to India.
Among the questions presented, two addressed mobility and participation succinctly. The first question asked, “How many days of the week do you leave your house?” and provided response options of never, 1-2 days, 3-4 days, or 5-7 days. The other question asked, “How frequently do you use transportation?” with response options of never, once or twice a month, once or twice a week, once or twice a day, or more than twice a day.
In relation to community participation, the questionnaire presented a novel question to find travel tendencies of the participants. This question presented a vertical list of locations in the community within a table and asked for answers to two travel characteristics per destination: (a) travel frequency to community locations and (b) transportation mismatch to the specified locations. Given 14 common locations in town, participants responded their travel frequency to locations in the first column as daily, several days a week, weekly, monthly, annually, never, or not a destination for me. The second column asked for the transport method used and the third asked for the preferred transport method unless the initial response to travel frequency was never or not a destination for me. For transportation mismatch, the measure counted when the transportation method used was not the preferred method for a given location (e.g. grocery store: method used – car passenger, preferred method – wheelchair). A final column allowed participants to designate a reason for their preferred method of transportation.
Statistical Analysis:
The Kruskal-Wallace test with post-hoc Mann-Whitney tests and Bonferroni correction determined if results on the community mobility measures were significantly different between groups based on driving status. To investigate the role of transportation mismatch, Chi-squared tests compared the odds of experiencing a mismatch for the same groups.
RESULTS
Upon completion of recruitment, 100 participants had been informed about the study and 80 had successfully completed the questionnaire. Among these participants, 68.8% selected to take the survey in English rather than Hindi. The participants were also 81.3% male, creating a minority female group. The average age of the study participants was 32.9 +/- 18.4 years (N=73, 7 subjects did not report age) with a range of 18 to 75. The distribution of participants by age peaked between 24 and 32 with eighty percent of participants in the range of 18 to 40. Three groups emerged when classified by age or disability type: senior citizens - 9 (11%), sensory impairment - 16 (20%), and physical impairments - 55 (69 %).
Responses were reported with respect to driving status (continue to drive, N=37; ceased driving, N=13; and no driving experience, N=30) in order to identify relationships with community mobility measures. In the explanation of results, the driving status groups will be termed as Continue, Ceased and No Driving respectively.
Leaving the Home
While there was no significant difference between groups, the responses to number of days leaving the home were visibly skewed towards 5-7 days a week and showed consistent trends across the three driving status groups (Figure 1). The difference in group sizes caused the difference in the Ceased group as the bars represent overall percentages (N=80). Unlike the No Drive group, seven participants from Continue and Ceased responded never leaving their home although they were not the one study participant who took the survey from home. Three of these respondents completed the questionnaire with the assistance of a sign language interpreter (also a participant). All four responded never and could have misunderstood the intent of the question. The responses may be inaccurate since the interpreter works full time and the others were students. Among the other three, two participants work full-time (financial coordinator and computer operator) and one is a volunteer. This may imply that they work from home or leave the home much less than weekly on average.
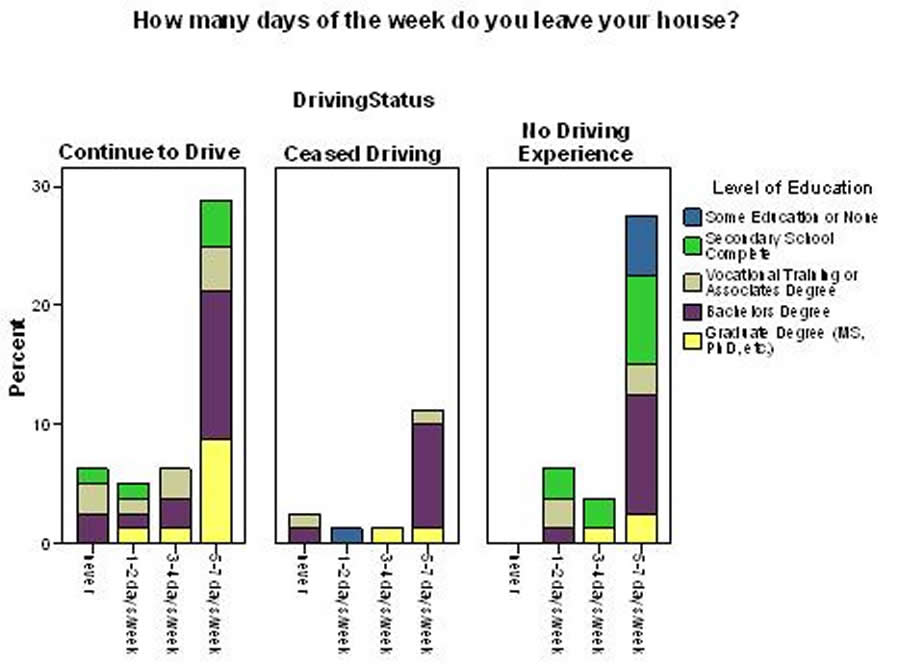
Figure 1. (Click for larger view)
With respect to education, there are no participants in the Continue group from the category “Some Education or None.” In addition, all people in the in the category “Graduate Degrees” leave the home three or more days a week except for one person in the Continue group, who works part-time. The rest in this group work full time except for one participant who is retired.
Using Transportation
The results for frequency of transportation usage are similar leaving the home with responses skewed towards more than twice a day (Figure 2). However, the distribution of responses does not follow the trend in the No Driving group. Reported frequency of transportation use differed significantly (H(2)=8.32, p=.014) by driving status in a Kruskal-Wallace test. From post hoc Mann-Whitney tests with Bonferroni correction (p=.025), transportation use was less frequent for people in No Driving (U=380.5, p=.019, r=-.285) than those in Continue. Inspection of the seven participants who use transportation more than twice a day revealed that all except one work full-time jobs for pay and all except two have college level education or better. The one participant who does not work full-time is a student with completion of secondary school. Overall, the responses imply that travel tendencies of participants in the Ceased group are more related to Continue than No Driving.
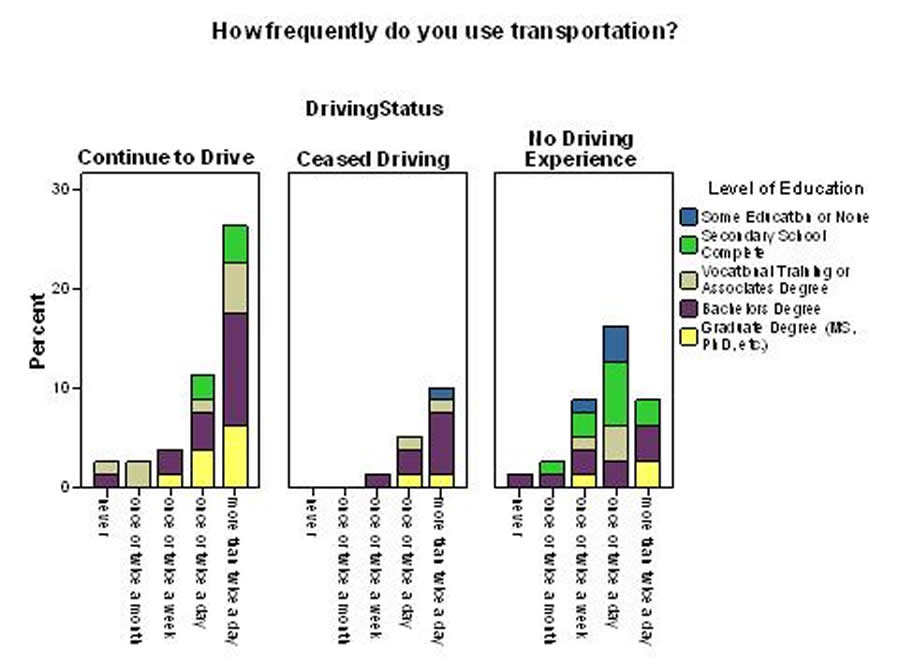
Figure 2. (Click for larger view)
In regards to the influence of education, the results show that no participants in the No Driving group and category “Some Education or None” responded as using transportation more than twice a day.
Transportation Mismatch
The experience of transportation mismatch was reported at similar levels among participants from each group. A review of the travel frequency responses showed that most participants considered the Grocery Store, Religious or Spiritual Function, and Park or Recreation Area as daily to weekly destinations. For these locations, transportation mismatch reporting increased with the frequency of transportation use. Table 1 shows the comparison of transportation mismatch between Continue and No Driving. From the results, there are no significant Chi-Squared test statistics for any of the most frequently traveled locations. Thus, responses seem to suggest that hardships from an inability to use preferred methods of transportation exist for all people regardless of driving status. However, there may be a difference between locations requiring transportation and locations close to home.
|
At Grocery Store |
At Religious or Spiritual Function |
At Park or Recreation Area |
|||
|---|---|---|---|---|---|---|
Yes |
No |
Yes |
No |
Yes |
No |
|
Continue to Drive |
7 |
30 |
10 |
27 |
8 |
29 |
No Driving Experience |
6 |
24 |
8 |
22 |
8 |
22 |
X2 |
.012 |
.001 |
.232 |
|||
Sig. |
1.000 |
1.000 |
.775 |
|||
DISCUSSION
In general, driving status does not impact mobility out of the home. Beyond driving status, individuals with a higher level of education may be associated with higher frequency leaving the home. When traveling, people with no driving experience are significantly less likely to use transportation more than twice daily. Furthermore, no participants classified under “Some Education or None” reported to continue driving. Using the Indian classification for economic class (6), no participants in No Driving and classified as “Low Income” used transportation more than twice a day.
Following the results of transportation use, it appears that people who have ceased driving are more like those who continue to drive. Transportation usage more than twice a day may imply more “spontaneous” travel in the community, which was shown to be reduced in Figure 2 among people with no driving experience. However, travel frequency to common locations varied between the two groups. Ultimately, achievement in education coupled with full-time employment suggests higher levels of community participation.
The limitations of this study included a narrow age distribution and underrepresentation of senior citizens due to lack of time for further recruitment in India. As a result of the questionnaire length, participants may have also hurried their responses to questions towards the end of the survey
The measure of transportation mismatch was expected to be associated with lower frequency transportation usage. From participant feedback, many reasons contributed to having other preferred methods of transportation. For instance, a car is a symbol of status when going out to formal restaurants, while the bus is better than being driven by a family member when going to the movies on a date. In certain situations, transportation mismatch may be confounded due to tradeoffs between cost, convenience, and accessibility. For future studies, transportation mismatch should not be viewed independently. There needs to be some classification where transportation mismatch is acceptable versus potentially disenfranchising.
Overall, transportation mismatch results confirm that people with disabilities rely on strong inner drive to manage transportation challenges for highly active lives in society. The odds are still against people with no driving experience to achieve the same level of community mobility as their counterparts. These results support the advancement of international driver rehabilitation services and vehicle modifications for assisting people with an inner drive to engage in community affairs.
REFERENCES
- Bickenbach, Jerome E., Chatterji, Somnath, Badley, E. M., & Ustun, T. B. (1999). Models of disablement, universalism and the international classification of impairments, disabilities and handicaps. Social Science & Medicine, 48, 1173-1187.
- Nagrath, Sumati. Definitely Abled. Business World., Retrieved January 23, 2009, from http://www.businessworld.in/index.php/After-Hours/Definitely-Abled.html
- Beach, S.R., Schulz, R., De Bruine Bruin, W., Downs, J., Musa, D., & Matthews, J. (2008, November). Privacy attitudes and quality of life technology in disabled and non-disabled baby boomers and older adults. Paper presented at the Annual Scientific Meeting of the Gerontological Society of America, National Harbor, MD.
- Chaves, Eliana S., Boninger, Michael L., Cooper, Rosemarie, Fitzgerald, Shirley G., Gray, David B., & Cooper, Rory A. (2004). Assessing the Influence of Wheelchair Technology on Perception of Participation in Spinal Cord Injury. Archives of Physical Medicine and Rehabilitation, 85, 854-1858.
- Gray, David B., Hollingsworth, Holly H., Stark, Susan, & Morgan, Kerri A. (2007). A subjective measure of environmental facilitators and barriers to participation for people with mobility limitations.Disability and Rehabilitation, 1-10.
- Director-General of National Council of Applied Economic Research. (2004, March 9). Why is India Shining? Retrieved January 23, 2009, from www.rediff.com/money/2004/mar/09shining.htm
ACKNOWLEDGEMENTS
This material is based upon work supported by the National Science Foundation under Grant No. EEC-0540865 and Grant No. EEC-0552351. The Survey Research Program (SRP) within the University Center for Social and Urban Research (UCSUR) at the University of Pittsburgh provided survey technical support and production. The Indian Spinal Cord Injuries Centre hosted the research team during the study period and provided support to help with recruitment of study volunteers.
First Author
Nahom M. Beyene
Human Engineering Research Laboratories
VA Pittsburgh Healthcare System 151R-1
7180 Highland Drive
Pittsburgh, PA, 15206
412-954-5287